

 EN
EN

 English
 русский
 Français
 Español
 عربى
عربى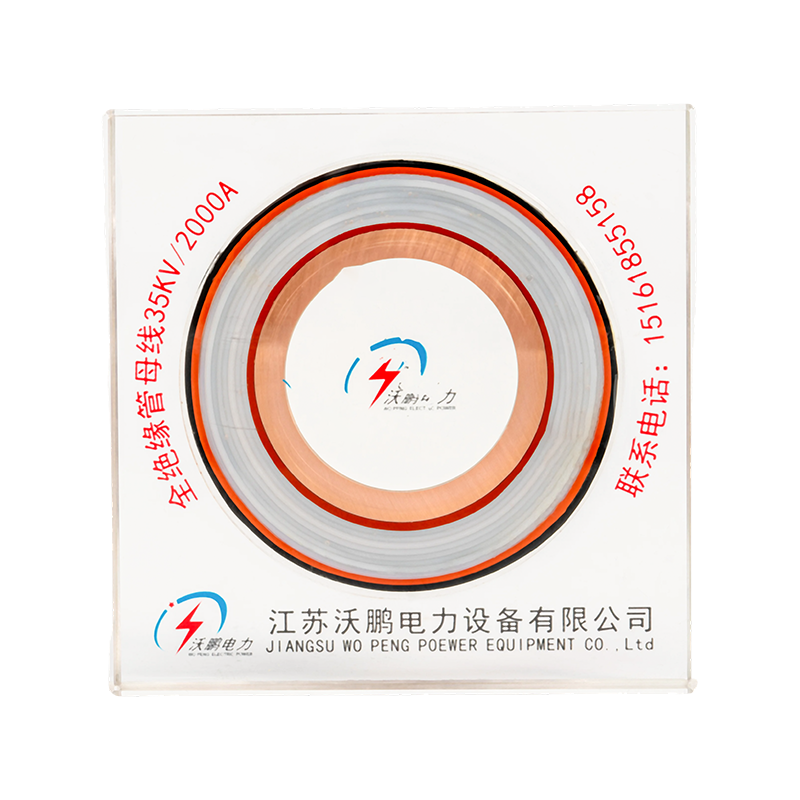
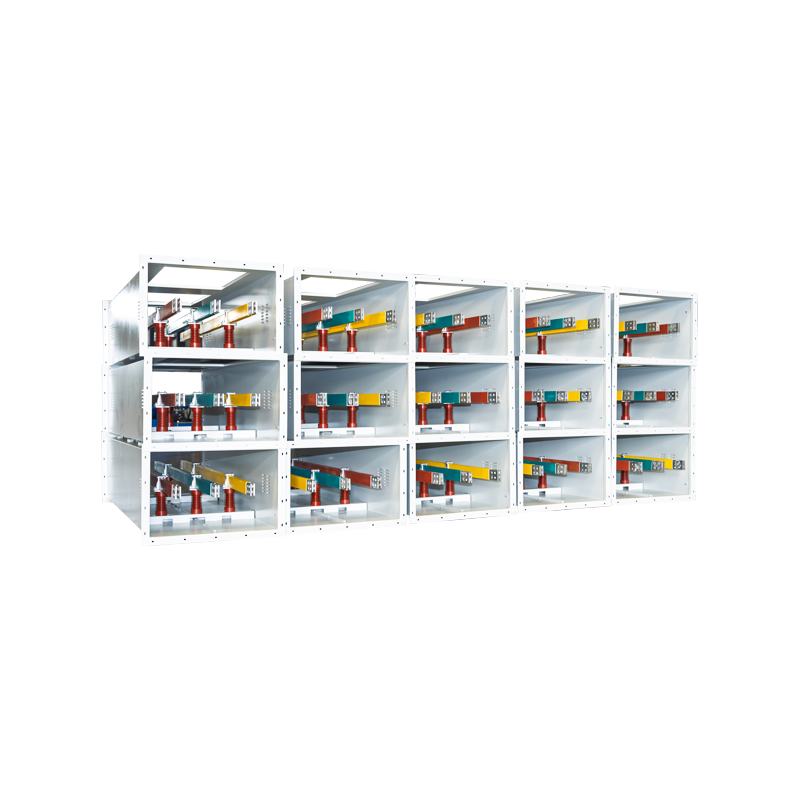


Aluminum Bus Bar Ampacity Chart: Sizes, Temperature Rise and Selection Tips
Content
- 1 What the Ampacity Number Actually Means
- 2 Aluminum Bus Bar Ampacity Chart: Common Sizes
- 3 How Temperature Rise Moves Every Number
- 4 Four Conditions That Quietly Rewrite the Chart
- 5 Aluminum Versus Copper: Reading Two Charts Together
- 6 A Practical Way to Use the Chart
- 7 Frequently Asked Questions
- 8 The Bottom Line for Buyers
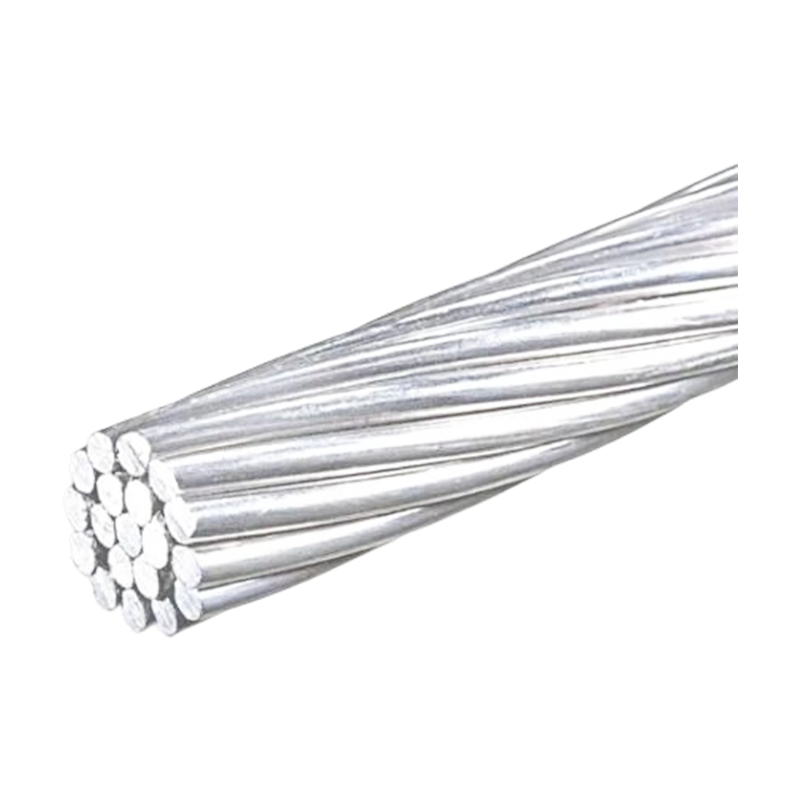
Ask two catalogs what a 100 × 10 mm aluminum bar can carry and you may get two different answers — 800 A from one, 965 A from another. Both can be right, because an aluminum bus bar ampacity chart is not a property of the metal alone; it is the result of fixed assumptions: temperature rise, ambient temperature, mounting orientation and enclosure. Read those assumptions before the numbers and the chart becomes the fastest sizing tool you have. Ignore them, and a bar that looks adequate on paper can run hot at its joints, oxidize, loosen and fail years before its design life ends. This guide explains what the chart actually states, gives indicative values for the sizes buyers ask about most, and shows how real installations move those numbers.
What the Ampacity Number Actually Means
Ampacity is the continuous current a bar carries while its temperature stabilizes at a stated rise above ambient. Most aluminum charts are drawn at a 30 °C rise over 40 °C ambient — a bar settling near 70 °C — while others use 50 °C or 65 °C. The rise is the whole story: heat generated is I²R, and temperature stops climbing the moment losses equal the heat the bar sheds. Change the permitted rise and you change the answer.
Buyers should care because everything around the bar has a lower limit than the bar itself. Assembly standards commonly cap the rise of bare busbars and bolted joints at around 60 K, a little more for plated surfaces; insulation classes age faster when hot; and a bare part at 70 °C is uncomfortable to touch. A chart drawn at a 30 °C rise therefore includes headroom that a 65 °C-rise chart does not — same metal, same size, two different ratings.
Aluminum Bus Bar Ampacity Chart: Common Sizes
The table below lists indicative ratings for single rectangular bars in electrical-grade aluminum (1350 or 6101-series), 60 Hz AC, edge-mounted in free air at a 30 °C rise over a 40 °C ambient. Values are rounded and deliberately conservative; certified test data always governs a final design.
| Bar size (mm) | Equivalent (in) | Cross-section (mm²) | Indicative ampacity (A) |
|---|---|---|---|
| 25 × 3 | 1 × 1/8 | 75 | ≈135 |
| 25 × 6 | 1 × 1/4 | 150 | ≈190 |
| 40 × 5 | 1.6 × 3/16 | 200 | ≈270 |
| 50 × 6 | 2 × 1/4 | 300 | ≈375 |
| 63 × 6 | 2.5 × 1/4 | 378 | ≈470 |
| 80 × 10 | 3 × 3/8 | 800 | ≈770 |
| 100 × 10 | 4 × 3/8 | 1,000 | ≈965 |
Two patterns are worth noticing. Small bars show higher current per square millimetre because they carry more cooling surface relative to their cross-section, and widening a bar helps more than thickening it — rating grows with width and roughly with the square root of thickness. The chart below makes the size-to-ampacity relationship easy to see at a glance.
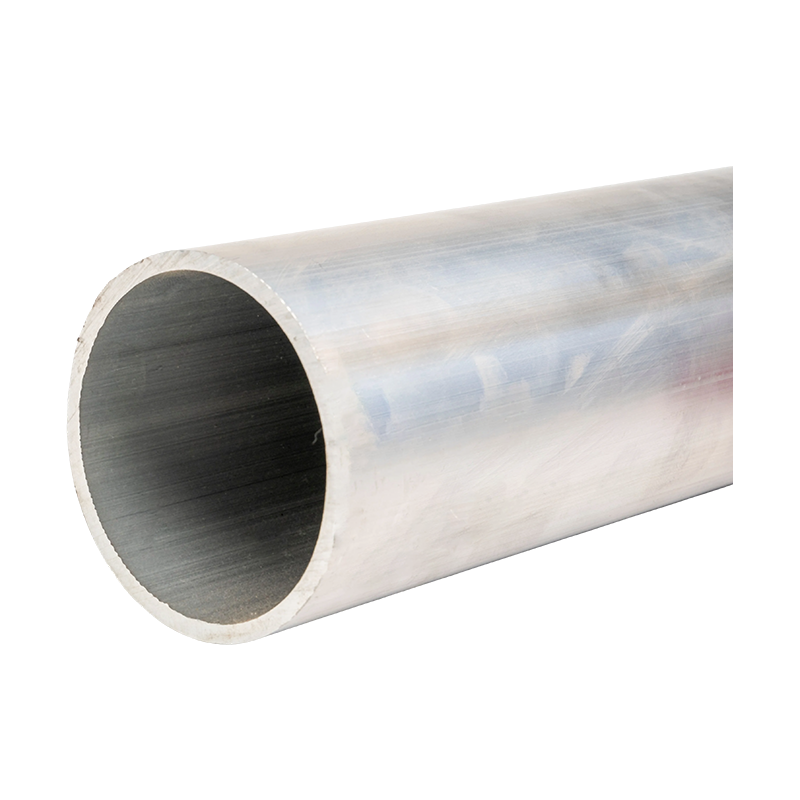
Rectangular bars are only one geometry, of course. For switchyards and high-voltage substations, tubular conductors are often preferred because their shape provides more cooling surface and better stiffness across long spans. Wopeng's aluminum alloy tubular bus bar range follows the same thermal logic as the chart above, with each size confirmed against the project's load and span.
 Aluminum Alloy Tubular Bus Bar for Substation ProjectsAvailable in 6063G, LF-21Y, 6R05 and 2A14 alloys, these tubular bus bars serve as overcurrent conductors in substations up to 1000 kV. Their seamless casting and good convection cooling suit the span and load conditions discussed above.View Product →
How Temperature Rise Moves Every Number
The same 100 × 10 mm bar reads very differently as the permitted rise changes. Because a bar sheds heat in proportion to its temperature difference from the surrounding air, ampacity follows the square root of the rise as a working approximation.
That third point deserves caution. A 70 °C rise over a 40 °C day puts the bar near 110 °C — beyond what ordinary bolted joints, standard insulation and most enclosure ratings tolerate. High-rise charts assume specific alloys, coatings or contact designs. For everyday switchboards and busways, treat the 30 °C-rise column as the planning basis and let ambient do the derating: a hotter day shrinks the permitted rise, and the current with it.
Four Conditions That Quietly Rewrite the Chart
Two identical bars can differ by 30 percent in the field. Four corrections account for most of the gap, and they multiply — they do not add.
| Installation condition | Indicative multiplier |
|---|---|
| Edge-mounted in free air (chart basis) | 1.00 |
| Flat-mounted (horizontal) bar | ≈0.90 |
| Bar enclosed in a busway housing | ≈0.70–0.80 |
| Two parallel bars, spaced one bar-width apart | ≈1.80 total |
| Ambient 50 °C instead of 40 °C at the same maximum bar temperature | ≈0.85 |
Mounting orientation
Charts assume edge-mounted bars, where air slides freely along the wide faces. Lay the same bar flat and the upper face traps a warm film, cutting output by roughly 10 percent — more where phases are stacked closely together.
AC versus DC
At power frequency, alternating current crowds toward the bar surface through skin effect; skin depth in aluminum is about 11–12 mm. Sections thicker than roughly 20 mm therefore carry AC less efficiently than DC, and DC ratings come out slightly higher. The effect is minor on small bars and real on heavy ones.
Parallel bars
Doubling conductors never doubles the rating. Two parallel bars shield each other's surfaces, so a pair spaced one bar-width apart delivers about 1.8 times a single bar; tighter spacing reduces that further, wider spacing recovers it.
Enclosure and insulation
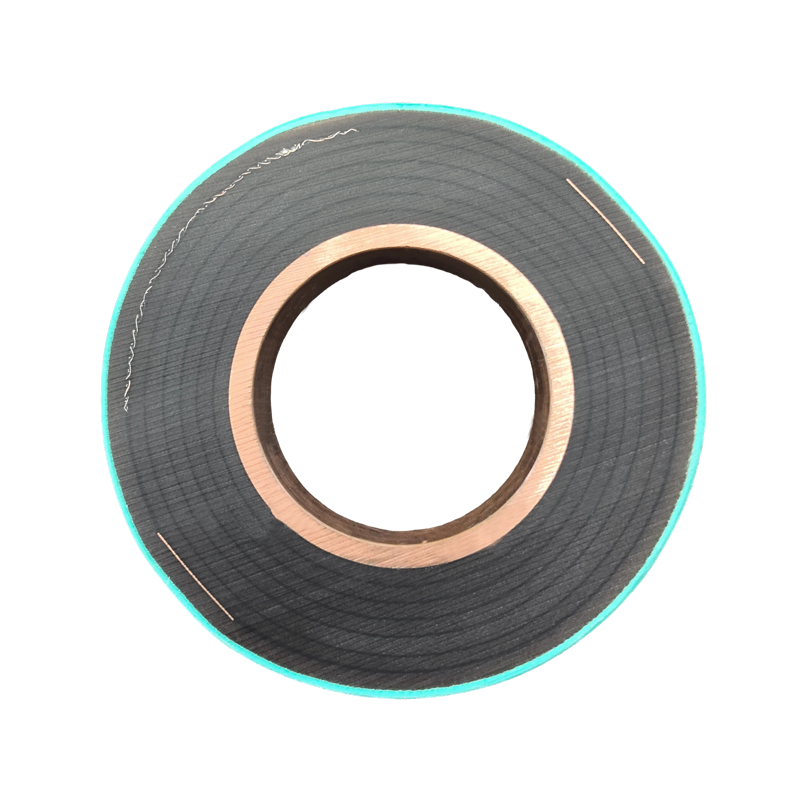
A bar inside a busway housing loses free convection and radiates to nearby walls, which is why enclosed ratings always sit below open-air chart values. Full insulation adds a thermal layer as well: with an epoxy-resin-cast tubular bus bar, the resin is part of the thermal and dielectric design, and the manufacturer's tested rating — not a generic chart — is the number to specify.
 Epoxy Resin Casting Tubular Bus BarThis fully encapsulated bus bar uses vacuum-injected epoxy resin with integrated shielding and oxygen-free copper conductors. Because the resin adds thermal resistance, its tested manufacturer rating is the correct figure to specify over generic open-air charts.View Product →
Aluminum Versus Copper: Reading Two Charts Together
Per equal cross-section, aluminum conducts about 61 percent as well as copper — the IACS benchmark visualized below. That single number explains most of the difference between any aluminum chart and any copper chart.
- Aluminum — 61% of copper
- Conductivity gap — 39%
In practice, a same-size aluminum bar carries roughly 60–65 percent of a copper bar's current at the same rise. To match a copper rating, specify about 1.6 times the cross-section — usually by adding width or height while keeping standard thicknesses. Even then, aluminum weighs about half as much as the copper bar it replaces, which keeps supports lighter and installation faster — one reason tubular aluminum dominates outdoor switchyards.
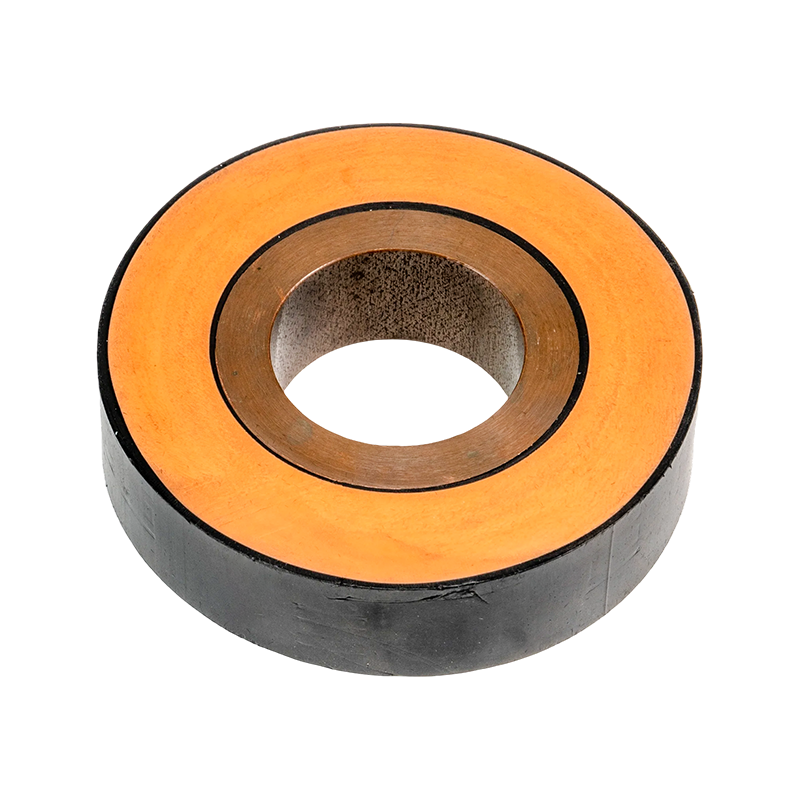
Alloying shifts the chart too. Magnesium-aluminum alloys trade a little conductivity for stiffness and strength, which is precisely what long spans in extra-high-voltage switchyards demand — the ultrahigh-voltage magnesium-aluminum tubular bus bar we produce exists for exactly that trade-off.
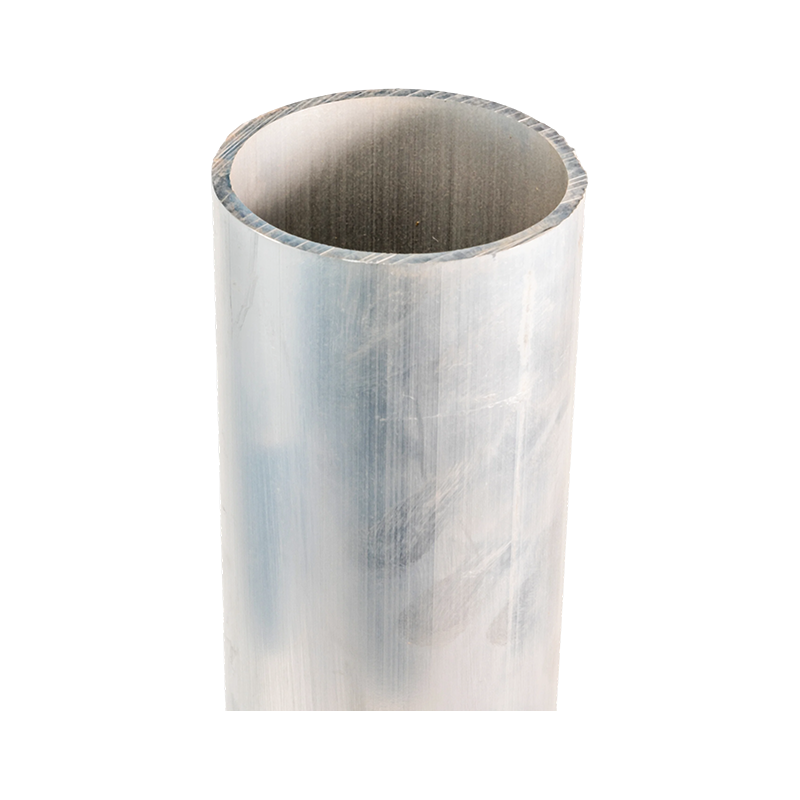 Ultra-high Voltage Magnesium-Aluminum Alloy Tubular Bus BarMade by hot top casting and piercing-rolling into seamless tubes, this magnesium-aluminum bus bar trades some conductivity for stiffness and strength. That trade-off suits long spans in 220 kV to 1000 kV ultrahigh-voltage switchyards.View Product →
A Practical Way to Use the Chart
- Fix the conditions first: continuous load current, ambient temperature, permitted rise, mounting orientation and enclosure type.
- Read the base rating for your candidate size from the chart.
- Apply correction factors for orientation, enclosure and ambient, then round down — never up.
- Check mechanical limits separately: short-circuit forces, span deflection and support spacing are outside what ampacity covers.
- Design the joints deliberately: contact area, plating, bolt torque and washer type decide whether the chart value survives at the connections.
- Confirm the final size against the manufacturer's certified test data before ordering.
For the fuller selection picture — alloys, tubular geometries and insulation options — our guide to selecting the right aluminum alloy tubular bus bar walks through the decision step by step.
Frequently Asked Questions
How many amps can an aluminum bus bar carry per mm²?
Common rectangular sizes land between roughly 1 and 1.8 A/mm² at a 30 °C rise, with the higher density in the smaller bars. For continuous loads inside enclosures, many engineers carry a conservative 0.8–1.0 A/mm² planning figure — consistent with the long-standing rule of about 700 A per square inch (≈1.1 A/mm²) as a continuous ceiling.
Can I replace a copper bar with aluminum of the same size?
Not one-for-one. At equal size, aluminum carries about 60 percent of copper's current, so you need roughly 1.6 times the cross-section. Budget for aluminum's oxide layer and creep as well: plated contact surfaces and spring washers are part of a proper swap.
Why do ampacity charts from different sources disagree?
Different assumptions — alloy, temperature rise, ambient, orientation, enclosure, surface emissivity, even AC versus DC. Two charts are only comparable when their conditions match, so check the footnotes before the numbers.
Does a thicker bar always carry more current?
Yes, but less than you might expect. Rating grows with the square root of thickness, so doubling thickness adds about 40 percent, while doubling width nearly doubles the rating. Wide, thin bars beat tall, thick ones thermally.
The Bottom Line for Buyers
An aluminum bus bar ampacity chart is a starting point, not a verdict. Read its conditions first, apply the corrections your installation imposes, and let certified data confirm the last mile. Bars chosen this way stay cool where busbars actually fail: at the joints.
If you are matching a chart value to a live project, contact our engineering team with your load current, ambient conditions, orientation and enclosure details, and we will confirm the size against tested products rather than generic tables.



-
 +86-180 3625 3000
-
 admin@wpbusbar.com
-
 No. 8, Yanjin Road, Chengxi Industrial Park, Shanyang Town, Baoying County, Yangzhou City, Jiangsu Province, China
Copyright © Jiangsu Wopeng Power Technology Co., Ltd.
All Rights Reserved.
 Custom Insulated Bus Bar Manufacturer
Tubular Busbar System Factory
Custom Insulated Bus Bar Manufacturer
Tubular Busbar System Factory